Tip
Check out:
our DEMO system
our Video tutorials
our GitHub sponsors => a way of supporting the project
Dashboard
Description
How to configure dashboards in the GrowAutomation webinterface.
Elements
Dashboard elements can be added to dashboards.
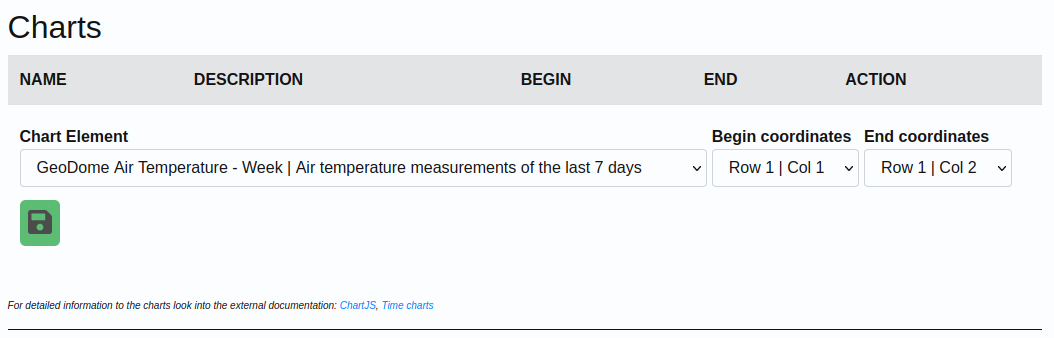
You have to configure it using the ‘Data - Charts’ site.
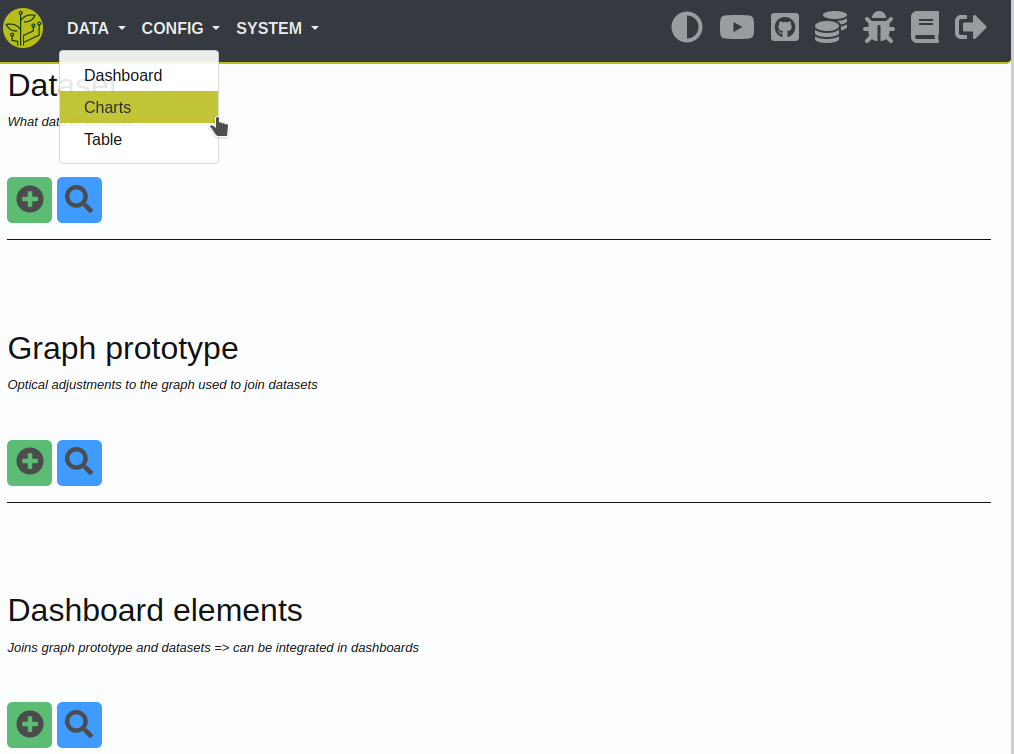
They are built of ‘datasets’ and ‘graphs’.

Graphs
A ‘graph’ defines some basic settings for the dashboard-element.
Per example:
time/date formats
x/y axis settings
chart.js custom configuration
data unit
Datasets
A ‘dataset’ is used to configure what data will be displayed.
You have to set:
an input-device
some data-range
a data-function (minimum, average, maximum)
visual settings
Dashboards
After creating your dashboard-elements you can add them to a dashboard.
To do that you first have to create a dashboard.
You can do this by choosing ‘Create’ on the site ‘Data - Dashboard’ and clicking on the ‘Select’ button.
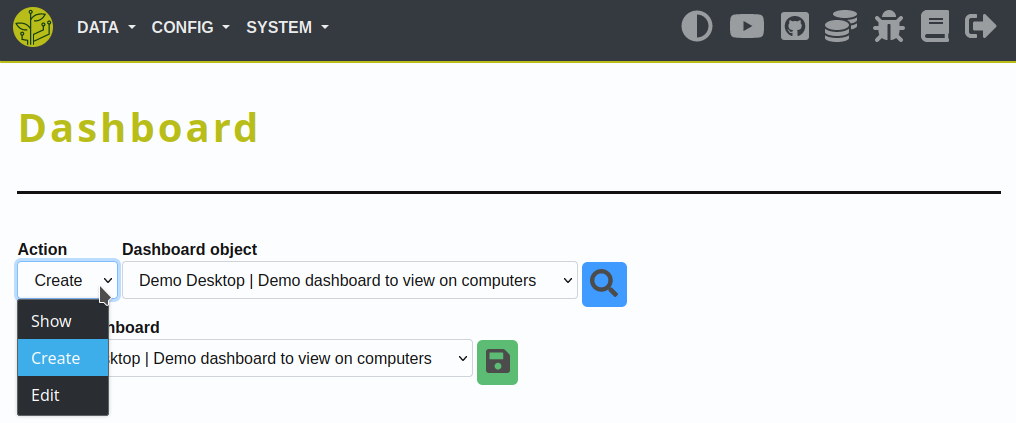
Give the dashboard a name and set the size of the dashboard (row times columns) and click on ‘Save’.
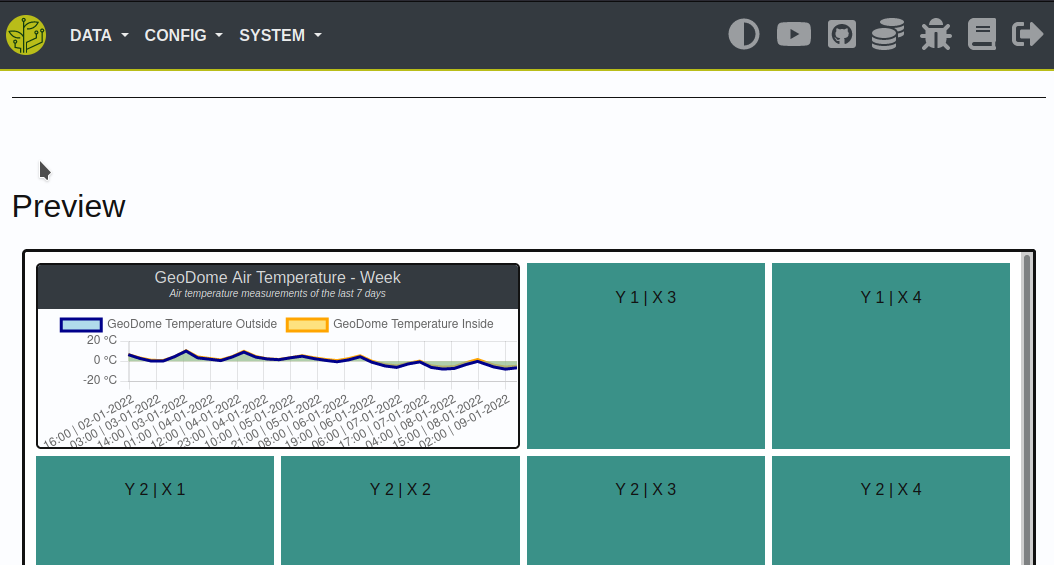
You now can see a preview of your new dashboard.
At the bottom you can add elements to the dashboard and choose their size and position.
You then can verify the looks of it in the preview and modify it if needed.